Plotting a graph with Plotly in Hugo using data from RESTful API

by Samuele Lilliu | 25 January 2023

How to retrieve data from a RESTful API and have it displayed on a Hugo static website using Plotly and Javascript.

X
  • Editor: Samuele Lilliu
  • Software: Hugo, VisualStudio, Javascript, Plotly

Introduction

Plotly is a data visualization library for creating interactive charts and graphs. It is available in Python, R, and JavaScript, and can be used to create a wide variety of plots, including line plots, scatter plots, bar plots, error bars, box plots, histograms, heatmaps, and more. Plotly is known for its ability to create interactive plots that can be embedded in web applications, dashboards, and documents. It also has a robust API for customizing plots and a built-in support for creating and collaborating on plots online. Plotly is open source and free to use, and is widely used in a variety of industries, including finance, healthcare, education, and scientific research.

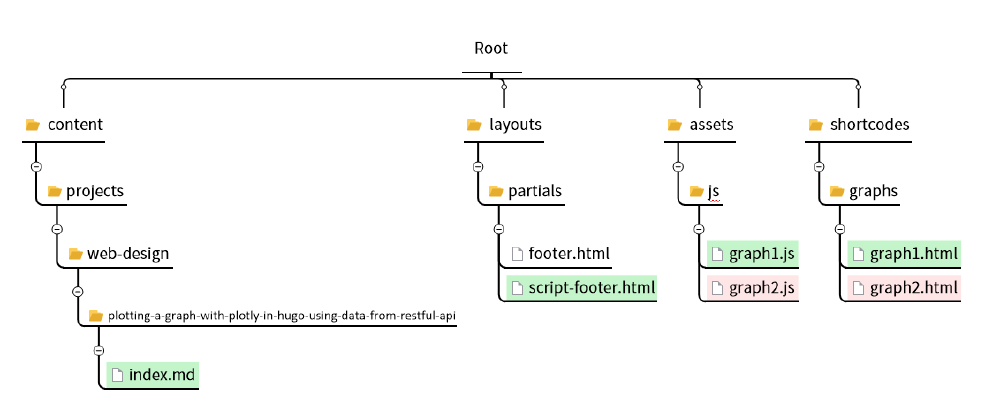
This is the structure of folders and files we will be referring to:

Folder Structure

First of all, we want to only import the plotly.js library only in the pages that need it. We also need to write a graph1.js file that will take care of the plot. This file should only be loaded in this specific page and not for the entire website. We do this selective javascript file loading by adding a parameter loadjs in the YAML index.md markdown file:

loadjs: [plotly, graph.js]

And by adding a bit of code in the partial script-footer.html, which is called within the footer.html partial:

1
2
3
4
{{ if in .Params.loadjs "graph1"}}
  <script src="https://cdn.plot.ly/plotly-2.16.1.min.js"></script>
  {{ partial "esbuild" "js/graph1.js" . }}
{{end}}

In this way we conditionally load two javascript files: plotly.js (it’s minified version) and graph1.js.

Next, we run a simple test. Pick up a sample code from the plotly website and paste into graph1.js:

var trace1 = {
x: [1, 2, 3, 4],
y: [10, 15, 13, 17],
type: 'scatter',
};

var trace2 = {
x: [1, 2, 3, 4],
y: [16, 5, 11, 9],
type: 'scatter',
};

var data = [trace1, trace2];

Plotly.newPlot('myDiv1', data);

The last thing to do is to add a bit of HTML to display the graph. So we create a shortcode graph1.html

<div id="myDiv1"></div>
<figure class="figure">
  {{- if .Get "figureNumber" -}}
    <figcaption
      class="figure-caption py-1 text-start mx-auto d-block"
      style="width: 85%;"
    >
      <span><b>Figure {{ .Get "figureNumber" -}}</b> | </span
      >{{- .Get "caption" -}}
    </figcaption>
  {{- end -}}
</figure>

And then we insert this shortcode in the index.md markdown file:

{{<graphs/graph1 alt="A simple graph with Plotly" colSize="12">}}

This is the result:

Plotting Data Retrieved with a RESTful API with Plotly

Now that we’ve got the Plotly library working say we want to plot “US population vs Year” from 2013 to 2020. At this link we get the following JSON:

{
  "data": [
    {
      "ID Nation": "01000US",
      "Nation": "United States",
      "ID Year": 2020,
      "Year": "2020",
      "Population": 326569308,
      "Slug Nation": "united-states"
    },
    {
      "ID Nation": "01000US",
      "Nation": "United States",
      "ID Year": 2019,
      "Year": "2019",
      "Population": 324697795,
      "Slug Nation": "united-states"
    },
    {
      "ID Nation": "01000US",
      "Nation": "United States",
      "ID Year": 2018,
      "Year": "2018",
      "Population": 322903030,
      "Slug Nation": "united-states"
    },
    {
      "ID Nation": "01000US",
      "Nation": "United States",
      "ID Year": 2017,
      "Year": "2017",
      "Population": 321004407,
      "Slug Nation": "united-states"
    },
    {
      "ID Nation": "01000US",
      "Nation": "United States",
      "ID Year": 2016,
      "Year": "2016",
      "Population": 318558162,
      "Slug Nation": "united-states"
    },
    {
      "ID Nation": "01000US",
      "Nation": "United States",
      "ID Year": 2015,
      "Year": "2015",
      "Population": 316515021,
      "Slug Nation": "united-states"
    },
    {
      "ID Nation": "01000US",
      "Nation": "United States",
      "ID Year": 2014,
      "Year": "2014",
      "Population": 314107084,
      "Slug Nation": "united-states"
    },
    {
      "ID Nation": "01000US",
      "Nation": "United States",
      "ID Year": 2013,
      "Year": "2013",
      "Population": 311536594,
      "Slug Nation": "united-states"
    }
  ],
  "source": [
    {
      "measures": ["Population"],
      "annotations": {
        "source_name": "Census Bureau",
        "source_description": "The American Community Survey (ACS) is conducted by the US Census and sent to a portion of the population every year.",
        "dataset_name": "ACS 5-year Estimate",
        "dataset_link": "http://www.census.gov/programs-surveys/acs/",
        "table_id": "B01003",
        "topic": "Diversity",
        "subtopic": "Demographics"
      },
      "name": "acs_yg_total_population_5",
      "substitutions": []
    }
  ]
}

You might want to download a JSON extension for your Chrome browser to visualise the JSON file properly on your browser.

The code below does plot “population vs year”. It starts by defining a layout for the plot. You can find more information on how to customise Plotly charts here At this link. Here we are just adding a title, a title for the x-axis and a title for the y-axis. We are also showing a line for both axes.

In a new file graph2.js we can start by customising the Plotly chart (see here for more info). Here we are just adding a title, a title for the x-axis and a title for the y-axis. We are also showing a line for both axes.

layout = {
  // all "layout" attributes: #layout
  title: 'US Population', // more about "layout.title": #layout-title
  xaxis: {
    title: 'Year',
    showline: true,
  },
  yaxis: {
    title: 'Number of People',
    showline: true,
  },
};

Next, in the same graph2.js file, we take care of retrieving the JSON data with the REST API and plotting the graph:

const url = 'https://datausa.io/api/data?drilldowns=Nation&measures=Population';
function updateChart() {
  async function fetchData() {
    const response = await fetch(url);
    const datapoints = await response.json();

    return datapoints;
  }
  fetchData().then((datapoints) => {
    const year = datapoints.data.map(function (index) {
      return index['ID Year'];
    });
    const population = datapoints.data.map(function (index) {
      return index.Population;
    });
    var trace3 = {
      x: year,
      y: population,
      type: 'scatter',
    };
    var data = [trace3];
    Plotly.newPlot('myDiv2', data, layout);
  });

}

updateChart();

Let’s explain this bit of code now. This function

function updateChart() {
   async function fetchData() {
     const response = await fetch(url);
     const datapoints = await response.json();
     return datapoints;
   }

below takes care of retrieving the JSON file and plotting the graph. It is made of two parts:

  • an asynchronous function fetchData()
  • a call to the fetchData function.

Inside fetchData(), we fetch the data and assign it to response, which is the parsed into response. Here are some clarifications:

  • fetch() is a modern way to make HTTP requests in JavaScript. It allows you to send HTTP requests to a server and receive a response, and is designed to be a simpler and more powerful alternative to the older XMLHttpRequest function. One of the main benefits of fetch is that it returns a Promise, which makes it easy to use with async/await. This allows you to write asynchronous code that looks and behaves like synchronous code, making it easier to read and write.
  • await is a keyword in JavaScript that can only be used inside an async function. It is used to wait for the result of an asynchronous operation, such as a Promise.
  • json() is a method of the response object in JavaScript, which is returned by fetch() when you make an HTTP request. It is used to parse the body of the response as JSON data.

Let’s take a look at the next part of the code:

fetchData().then((datapoints) => {
  //
  });

What then does is that it waits for the data to be fetched and then it runs what’s after =>. then is a method of a Promise in JavaScript. It is used to register a callback function that will be executed when the Promise is resolved (i.e., when the asynchronous operation has completed successfully).

After the data is retrieved we want to just extract the vectors year and population. To access ID Year we need to navigate inside the JSON structure until we reach the array, this is done with datapoints.data. Once we reach the array we loop inside it with map. The map function is a method of the Array object in JavaScript. It is used to apply a function to each element in an array and return a new array with the results. Because there is a space in ID Year we need to use index[‘ID Year’].

const year = datapoints.data.map(function (index) {
       return index['ID Year'];
     });

We do something similar with population:

 const population = datapoints.data.map(function (index) {
       return index.Population;
     });

Once we are done with the assignment, we essentially build a variable trace3 that looks just like JSON and finally we plot with Plotly.newPlot:

var trace3 = {
       x: year,
       y: population,
       type: 'scatter',
     };
     var data = [trace3];
     Plotly.newPlot('myDiv2', data, layout);

We then create a graph2.html similar to graph1.html but with a different ID:

<div id="myDiv2"></div>
<figure class="figure">
  {{- if .Get "figureNumber" -}}
    <figcaption
      class="figure-caption py-1 text-start mx-auto d-block"
      style="width: 85%;"
    >
      <span><b>Figure {{ .Get "figureNumber" -}}</b> | </span
      >{{- .Get "caption" -}}
    </figcaption>
  {{- end -}}
</figure>

We also need to make sure graph.js is conditionally loaded in in the partial script-footer.html:

{{ if in .Params.loadjs (or "graph1" "graph2")}}
  <script src="https://cdn.plot.ly/plotly-2.16.1.min.js"></script>
  {{ partial "esbuild" "js/graph1.js" . }}
  {{ partial "esbuild" "js/graph2.js" . }}
{{end}}

To display the graph we add the following markdown code, as we did before: